I wanted to profile a SharePoint 2010 project i’d been working on, in order to find some of the slower methods so that they could be improved. I decided to give EQATEC Profiler a try since it had some good recommendations on StackOverflow and was FREE.
EQATEC works by modifying and rebuilding your assemblies. Since I use Visual Studio 2010’s built in package and deployment features, it needs to be run after the build, but before the project is packaged and deployed to the SharePoint server.
Here’s how I got it working:
- Start EQATEC Profiler. Under ‘Application to profile’ select your project’s bin\debug folder. Check-mark all of the assembly’s you would like to profile.

- Click ‘Build’. This will rebuild the project with added profiling bits, as well as add ‘app.eqconfig’ and ‘EQATEC.Profiler.RuntimeFullNet.dll’ to your output folder.
- The EQATEC assembly needs to be added to your project’s package for it to function properly.
- Open your project in Visual Studio 2010.
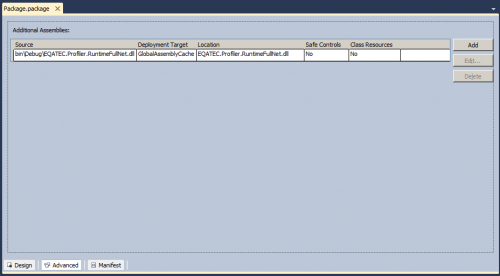
- Open your project’s package and click on the ‘Advanced’ tab.
- Click ‘Add’ -> ‘Add Existing Assembly…’. Browse and select ‘EQATEC.Profiler.RuntimeFullNet.dll’ from your bin\debug folder.
- You can leave the default location and selection of ‘Global Assembly Cache’.
- Click OK.
- Save the package.
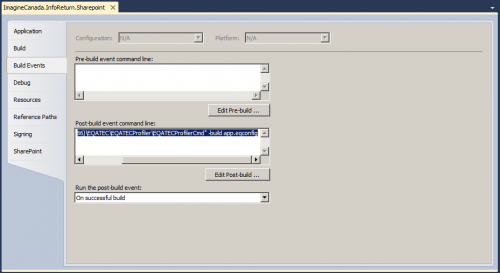
- Open the project properties and select the ‘Build Events’ tab. Add the following command to the Post-Build Commands:
"C:\Program Files (x86)\EQATEC\EQATECProfiler\EQATECProfilerCmd" -build app.eqconfig
This will cause your assemblies to be recompiled with EQATEC once the standard build is done.

- Deploy your project to SharePoint.
- Exercise your project in SharePoint.
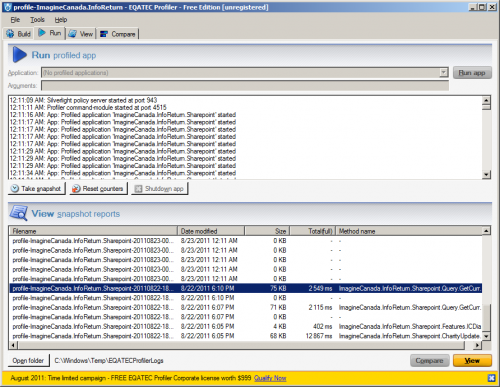
- In EQATEC, click on the Run tab. You should see messages that your profiled application has started.

- Once SharePoint has “warmed up” and your project is performing normally, click the ‘Reset Counters’ button in EQATEC. This will reset the profiling so that you can begin collecting data.
- Exercise your project in SharePoint. Make sure you exercise all code you’d like profiled.
- Back in EQATEC, click the ‘Take Snapshot’ button. This will create a report of your profiling session.
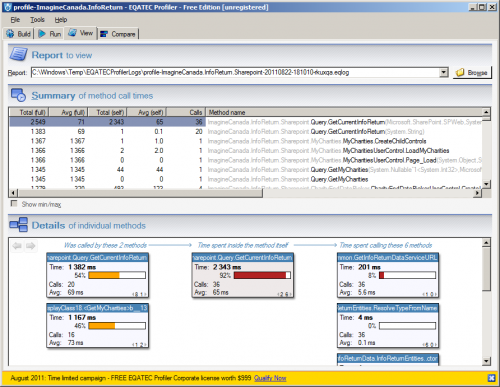
- Under ‘View snapshot reports’ double-click on the report you’d like to view. This will open the view tab, where you can explore the results of your profiling session and find the slower methods in your project.

- Don’t forget when you’re done profiling to remove the EQATEC assembly from your package as well as remove the post-build step. Leaving them in will decrease your project’s performance.


Leave a Reply to Chris Coulson Cancel reply